|
| Home > Investigating
Growth of Organisms > Monarchs |
| |
|
Monarchs
|
|
|
| Variation in Size and Growth |
| |
|
|
| Objective |
| |
| To develop tools for representing variation. To use these tools in describing patterns of variation in groups of organisms . |
|
| Overview of Lessons |
| |
Initially, students notice that caterpillars the same age are not all the same size, but most students are not familiar with ways to represent such variation. Students create, use and revise data displays, including frequency displays, that address questions about variation. For example, they compare the variation in larval length at different times in the life cycle. In our experience, the parts of this lesson extend over several class periods, and it helps to revisit these ideas during other tasks involving data displays and graphs. |
|
| Lessons |
| |
| Part 1:
How can the data be organized to help us learn about monarch variation? |
| |
| In Part 1, we explored two questions:
A. How much variation in size exists for monarch larvae?
Students organize class data on larva size and create a display that shows the variation in caterpillar length or width for a given day of the life cycle.
B. How much variation exists in duration of monarch stages?
Students create representations that show the length of time caterpillars spent in each of the four life cycle stages (larva, j-stage, chrysalis, adult). |
| |
|
| Part 2. What makes a data display clear and easy to interpret? |
| |
In whole class discussion, the displays are examined and interpreted. This discussion helped the class agree on which features of a display make it useful, and which displays are not easy to understand. Students became more aware of the need for clearer labels on data displays. Many displays were changed when students saw one particular group using a line plot. Students found it easier and clearer to group like sizes together instead of assigning a bar to each caterpillar. |
| |
|
| Part 3. How does variation in monarch length change over the life span? Do monarchs vary in the amount of time spent in each life stage? |
| |
A. How much variation exists in monarch larva size?
Returning to what the displays show about variation in caterpillar length and width, the class interprets and compares displays for different times in the life cycle. When, in the life cycle is the variation in larval length the greatest? The least? Which evidence from the data displays supports your ideas?
B. How much variation exists in the duration of monarch stages?
To compare the amount of time all caterpillars spent in their various stages, we discussed as a class how we could represent the data to make comparisons of all of the caterpillars. After creating one class representation, students looked at the variation in the amount of time each caterpillar stayed in each stage. We also shared our data with students at the middle school across town. |
| |
|
|
|
Children's thinking during class |
| |
| Part 1 |
| |
| During the early part of the unit, many students make graphs that superficially look like bar graphs, but they do not represent variation in conventional ways. Many of the bar graphs have pieces missing or show bars assigned for each caterpillar. |
| |
|
| |
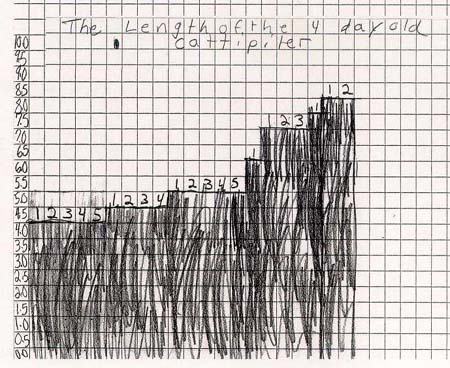
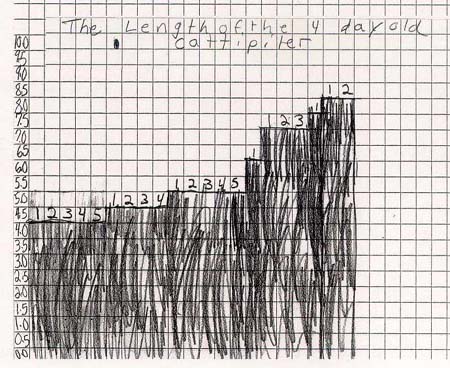
In this display of frequency data, the student shows each caterpillar as a vertical bar placed in ascending order. She numbered the bars, which shows the frequency of each value in the set. Students often make this kind of graph when they first attempt to represent variability.
|
|
|
| |
|
| |
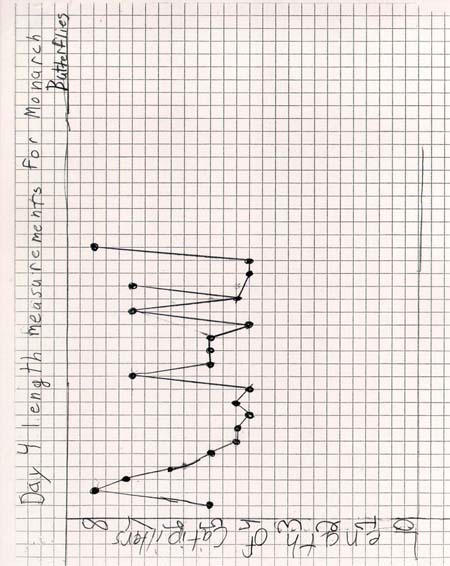
This display is also typical of students' early attempts to represent variability. Caterpillar lengths are plotted, with each point representing the length for a single caterpillar. In this case, the data are not presented in any particular order. The student connected the plotted points, although there is no reason to do so. This graph was created from the same data as the graph above. Both graphs provide teachers and children with opportunities to discuss useful or confusing aspects of the displays, and decide on ways to make them more clear.
|
|
|
| |
|
| |
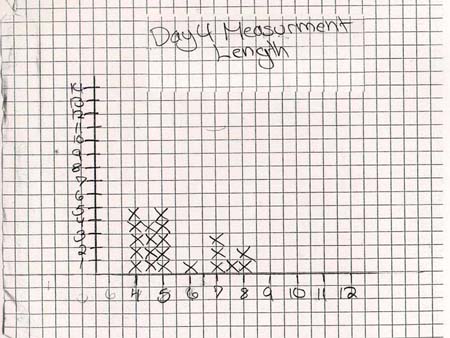
This frequency display was created by a student revising her original display. It shows the frequency of Day 4 larvae (lengths). The display has a more conventional form than the two examples above.
|
|
| Part 2 |
| |
Discussing their interpretations of the graphs made students more aware of the need for clearer labels on data displays. Many displays were changed when students saw one particular group using a line plot. Students focused on the ease of grouping like sizes together instead of assigning a bar to each caterpillar. |
| |
|
| |
In this display of frequency data, the student shows each caterpillar as a vertical bar placed in ascending order. She numbered the bars, which shows the frequency of each value in the set. Students often make this kind of graph when they first attempt to represent variability.
|
|
| Part 3 |
| |
A. How much variation exists in monarch larva size? Students quickly noticed there is little variation early in the caterpillar's life cycle compared to greater variation as the caterpillar prepares to enter the j-stage. Discussion centers around why we may see variation in older caterpillars. Students recognize it is difficult to measure the caterpillars accurately because they curl up.
B. How much variation exists in the duration of monarch stages? A few students tried to create a pie chart to show the amount of time their caterpillar spent in each stage. Pie charts were not accurate and most students gave up on that particular idea before they finished. Again, students went back to using a form of bar graph to show the amount of time their caterpillar spent in each stage.
Students seemed to favor the use of three different line plots, one for each stage of the cycle. While students saw little variation in larvae from their own classroom, they thought there was more variation between the two schools. This raised a question, Could this difference be related to the fact that one room was air conditioned while the other was not? |
|
|
|
| Go to the related big ideas |
|
|
|
Last Updated:
February 17, 2005
All Rights reserved
|
|
|