|
| Home > Investigating
Growth of Organisms > Monarchs |
| |
|
| Monarchs |
|
|
| Patterns of growth |
| |
|
|
| Objective |
| |
| To collect, record and display data to learn about growth patterns of monarch larvae. To create, use and interpret graphs that represent change in size over time. |
|
| Lessons |
| |
Using the line graphs that students created from data collected through the larva stage of the monarch life cycle, the class discusses and describes growth patterns. To highlight pattern, we plot more than one individual on the same graph, or overlay different graphs on the overhead projector. This allows students to move away from thinking about the small details of each individual and look at overall pattern. When overlaying graphs, they also need to consider the scales used to make the graphs. These are not often the same, and have to be converted for easier and more accurate comparison. Usually, this discussion is held when the class also explores growth rates. |
|
|
| |
| Students are generally able to describe larval growth qualitatively through interpreting the graphs. They identify intervals of slower and faster growth for one individual, by pointing out steep and less steep parts of the line on the graph. On graph overlays, they describe overall patterns such as steady growth or times when the larva does not change in size much (near the time of a molt early in the life cycle). |
| |
|
| |
|
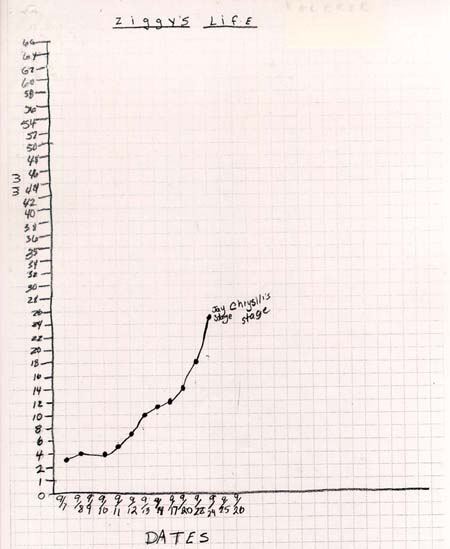
This example of student work is typical. Note that the scale on the horizontal axis is not linear; it begins with each square representing a day and then switches to other intervals. If the graph is to be used to make claims about growth, it is important to notice and understand why a graph with uneven intervals is more difficult to interpret than one that uses linear scales. The particular larva (Ziggy) shown on this graph was unusually small when it went into the j-stage and chrysalis.
|
|
|
|
|
| |
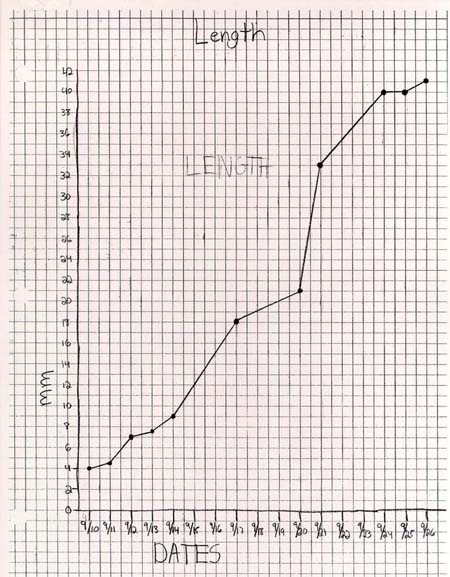
This graph, the student uses linear scales for the graph. It can be used directly to learn about growth patterns and rates. This particular larva is an example of a typical growth pattern for the monarch larvae we raise in the classrooms, both in terms of size and time of development.
|
| |
|
|
|
|
|
|
Last Updated:
February 17, 2005
All Rights reserved
|
|
|