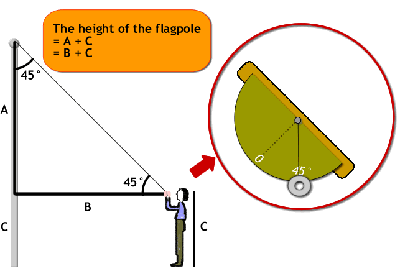
Students measure the height of an object, such as the school's flagpole or a tall tree, using indirect methods that involve triangle trigonometry. ( Triangle Investigations explores properties of triangles and triangle trigonometry, but the lesson can be conducted without this background.) To measure the height of the flagpole, students walk away from the base of the flagpole, stopping when their angle-measuring instrument indicates that their line of sight toward the top of the flagpole measures 45 degrees (implying that the angle between the top of the flagpole and the line of sight is also 45 degrees) . They then measure their distance from the flagpole base (B), which will be approximately the same (within measurement error) as a part of the height of the flagpole (A).

To correct for the fact that the 45-degree angle has been recorded at their eye level, they will need to add their own height (C) onto the estimated height of the flagpole (B), as illustrated in the diagram.
After each person has measured the height (at least once), the measures obtained are collected. Students work in small groups to design a display that shows, without words, all of the data and any of the trends about the data that they notice. Students post their displays and classmates, but not the designer, attempt to interpret their meaning. The pedagogical intention is to explore different senses of the �shape of the data. Student inventions are often idiosyncratic but the variability of student designs is important for grounding discussion about qualities of data display. Hence, the teacher employs a language for fostering meta-representational competence by asking the class to consider which features of the data are highlighted by a particular display and which it makes less obvious or even hides. The pedagogical intention is to foster the development of meta-representational competence. After discussing qualities of displays, the lesson concludes by soliciting students' ideas about sources of these qualities. What about the measurement process might lead to the shapes of the data observed?