Silverman, J.B.; Krystofiak, E.E.; Caplan, L.R.; Lau, K.S.; Tyska, M.J. “Organization of a cytoskeletal superstructure in the apical domain of intestinal tuft cells.” The Journal of Cell Biology, Volume 223, Issue 12, 2024, DOI: 10.1083/jcb.202404070.
Tuft cells are rare cells in the lining of the intestine that help detect and respond to substances in the gut. These cells have a unique “tuft” of fingerlike structures at their top, made of tightly organized bundles of actin (a structural protein) and specialized proteins arranged in specific patterns. Beneath the tuft, these actin bundles align with a network of microtubules (another structural component), creating a sturdy framework. This structure supports the cell’s ability to transport materials and perform its sensing functions, which are essential for maintaining gut health.

Figure 1.
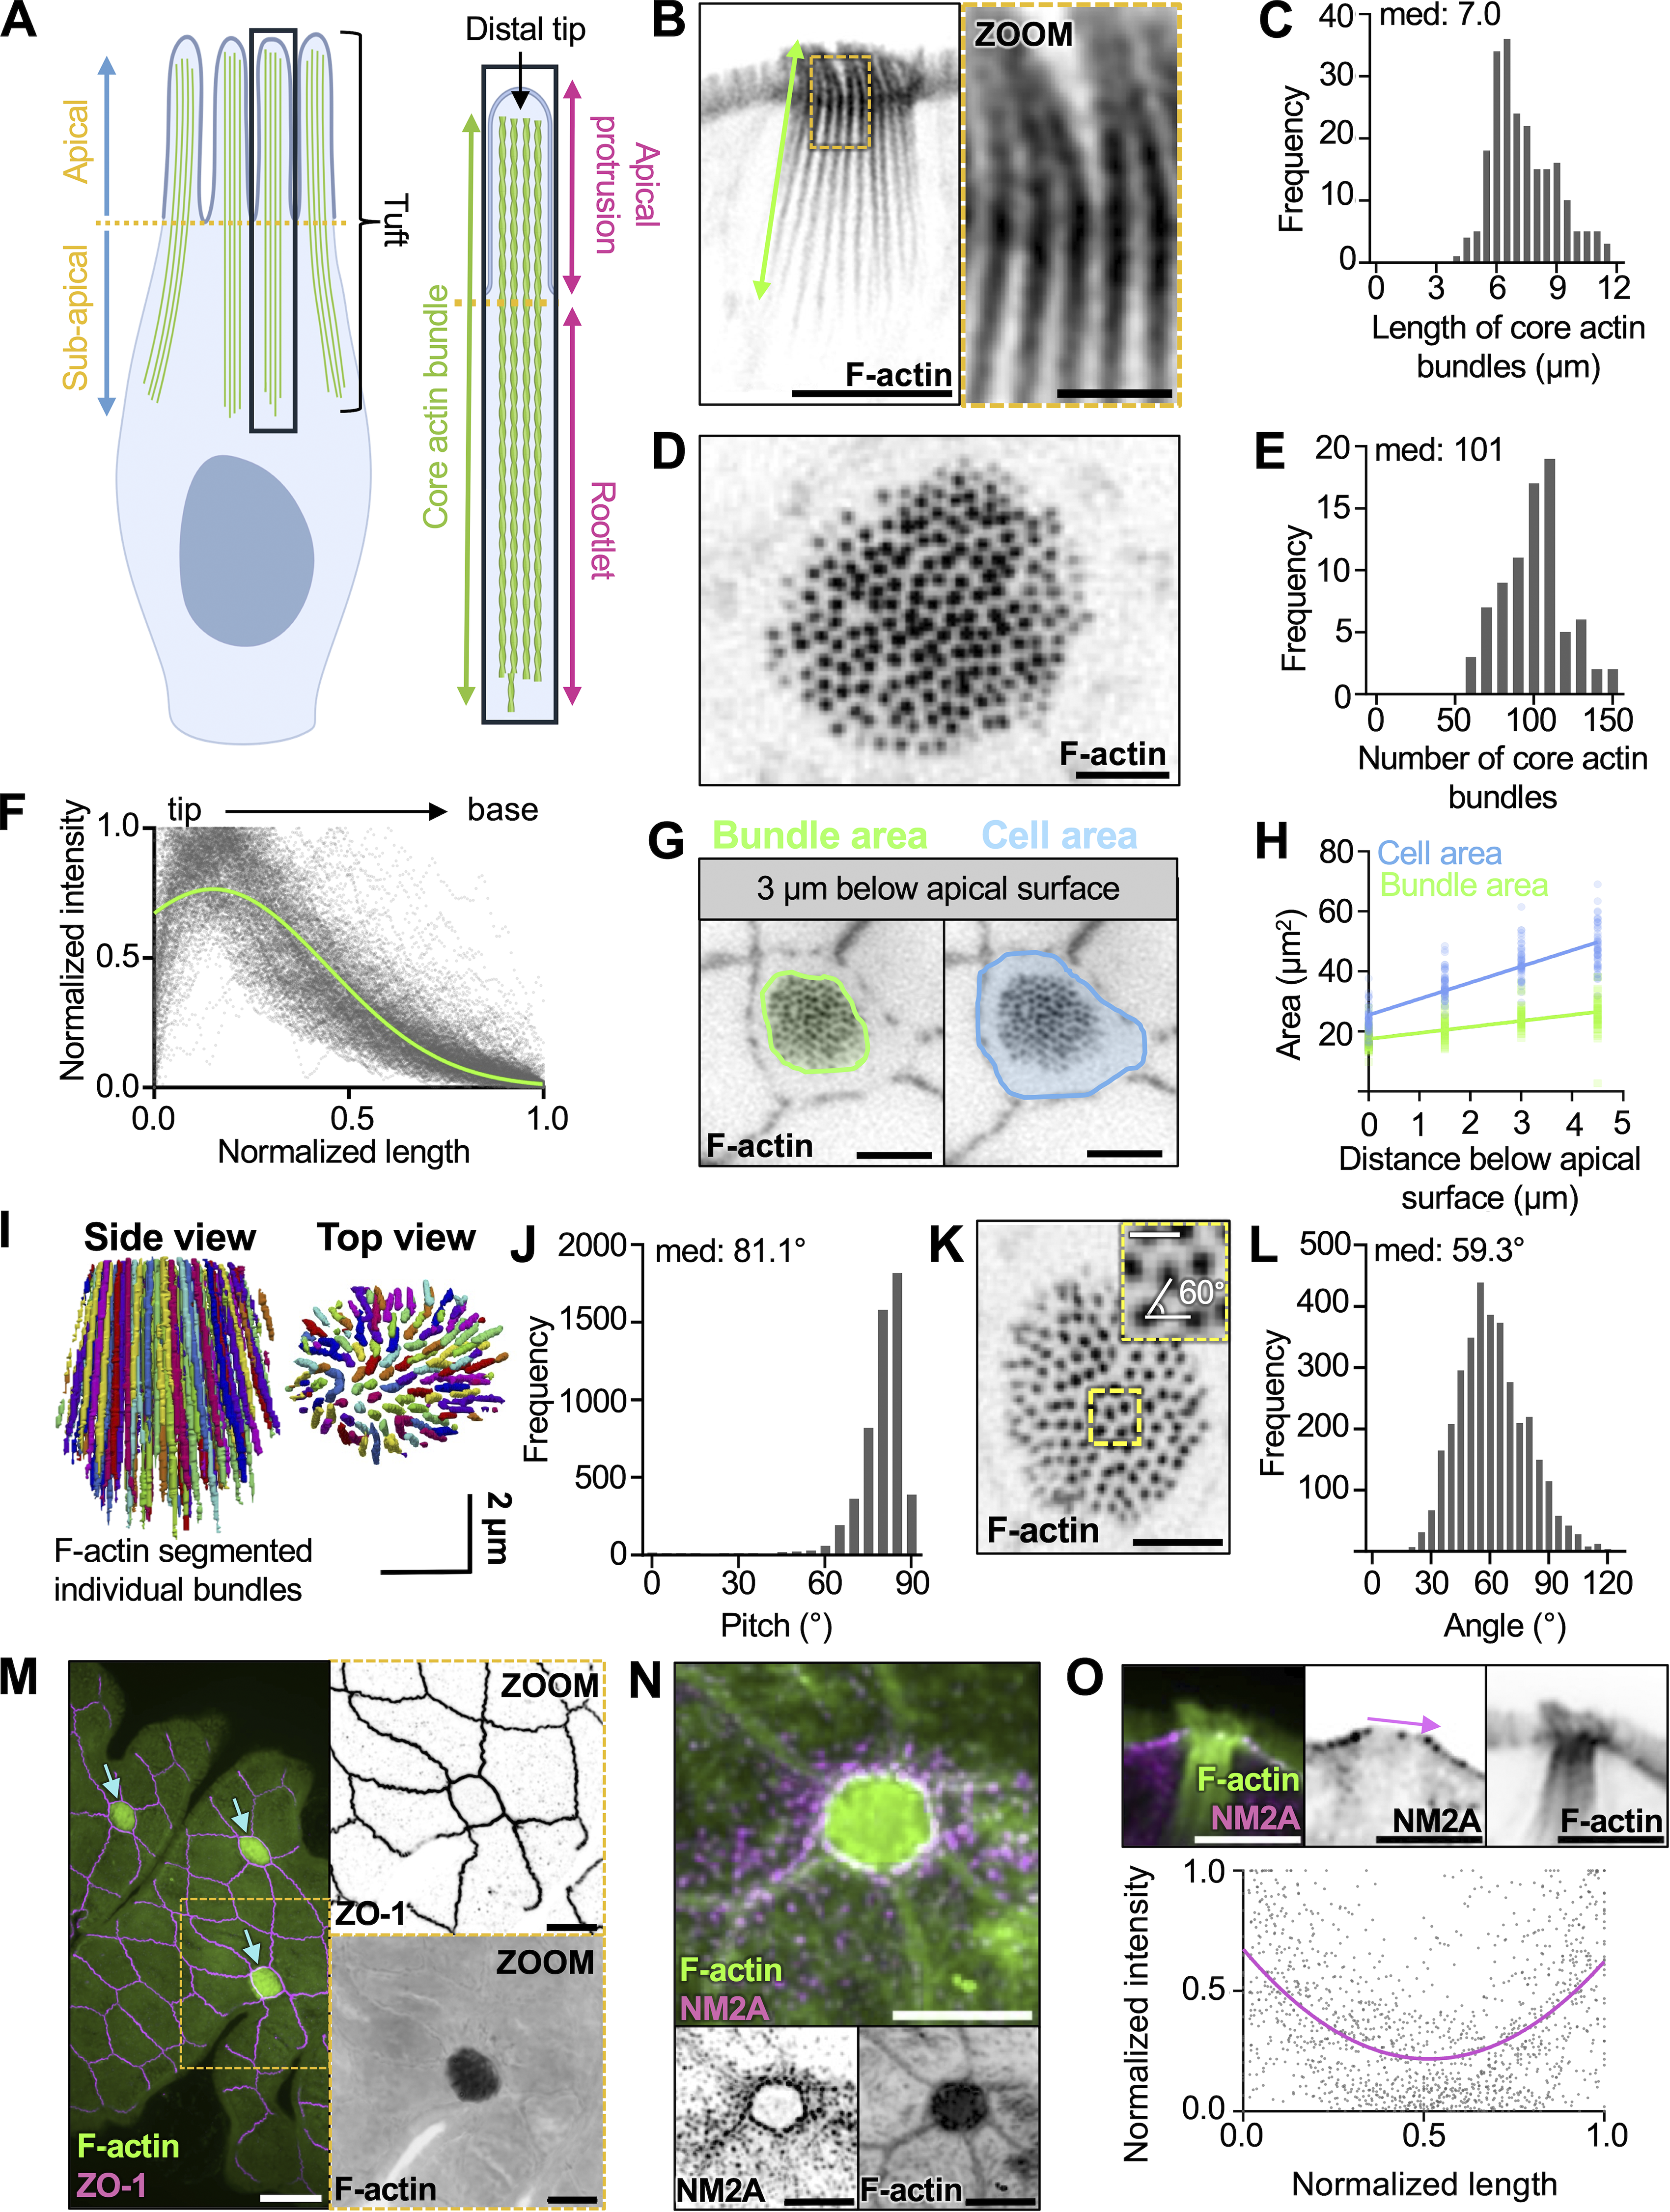
The tuft cell “tuft” contains over a hundred of core actin bundles. (A) Cartoon depicting nomenclature for core actin bundles in tuft cells. (B) Inverted single channel, single z-slice, Airyscan image of a lateral tissue section of tuft cell. Actin marked with phalloidin (scalebar = 5 µm, zoom = 1 µm). (C) Frequency diagram of core bundle length as depicted in B (n = 27 tuft cells over 3 mice). (D) Max intensity projection (MaxIP) spinning disk confocal (SDC) image using en face whole-mount tissue of a tuft cell captured beneath the apical membrane with phalloidin staining (scalebar = 2 µm). (E) Frequency diagram of the number of core actin bundles in tuft cells (n = 81 tuft cells over 3 mice). (F) Using lateral sections of frozen tissue, linescans of phalloidin intensity were drawn from the tip to the base of core actin bundles. Raw linescan data is shown in gray with a curve fit to data shown in green. (n = 218 bundles over 3 mice). (G) Single z-slice SDC image of en face whole-mount tissue (scalebar = 5 µm). (H) Simple linear regression measuring cell or bundle area (as shown in G) at 1.5, 3, and 4.5 µm beneath the apical surface. Slope bundle area = 2.013. Slope cell area = 5.412 (n = 54 tuft cells over 3 mice). (I) 3D projection of core actin bundles in a tuft cell using Trainable WEKA segmentation. (J) Pitch of individual actin bundles relative to the long axis of the cell (90° = vertical orientation) using WEKA segmented data from I (n = 35 tuft cells over 3 mice). (K)MaxIP SDC image of en face whole-mount tissue section with showing sub-apical core bundles (scalebar = 2 µm, inset box scalebar = 500 nm). (L) Frequency diagram of angle measurements between neighboring bundles as shown in zoom inset K (n = 3,453 measurements made in 25 tuft cells over 3 mice). (M) MaxIP SDC image of en face whole-mount tissue with ZO-1 (magenta) and actin marked by phalloidin (green). Arrows point to tuft cells. (scalebar = 5 µm). (N) MaxIP SDC image of en face frozen tissue section with NM2A (magenta) and actin marked with phalloidin (green) (scalebar = 5 µm). (O) Above: single z-slice image of a lateral frozen tissue section with NM2A (magenta) and actin marked with phalloidin (green) (scalebar = 5 µm). Below: linescans measuring the intensity of NM2A across the apical surface of tuft cells as shown by the pink arrow in the image above (n = 33 tuft cells over 3 mice).