Kaur, H.; Heiser, C.N.; McKinley, E.T.; Ventura-Antunes, L.; Harris, C.R.; Roland, J.T.; Farrow, M.A.; Selden, H.J.; Pingry, E.L.; Moore, J.F.; Ehrlich, L.I.R.; Shrubsole, M.J.; Spraggins, J.M.; Coffey, R.J.; Lau, K.S.; Vandekar, S.N. “Consensus tissue domain detection in spatial omics data using multiplex image labeling with regional morphology (MILWRM).” Communications Biology, Volume 7, Issue 1, 2024, Article 1295, DOI: 10.1038/s42003-024-06281-8.
New molecular imaging methods can capture detailed genetic and protein information directly from tissues, allowing scientists to study diseases while keeping the original structure of the tissue intact. By combining this molecular data with traditional tissue images, researchers can learn more about how different parts of tissues are affected by diseases. However, making sense of all this complex data, especially when comparing many samples, is challenging.
To help with this, we created MILWRM, a Python tool that can quickly find and label different areas within tissue samples. MILWRM analyzes images and groups similar parts of the tissue together, making it easier to identify specific regions.
We tested MILWRM on various tissue samples, including human colon polyps, lymph nodes, mouse kidneys, and mouse brain slices. The tool was able to distinguish different types of polyps and identify unique areas in the brain based on their molecular characteristics. MILWRM helps researchers understand the structure and molecular features of tissues, making it a valuable tool for studying diseases.

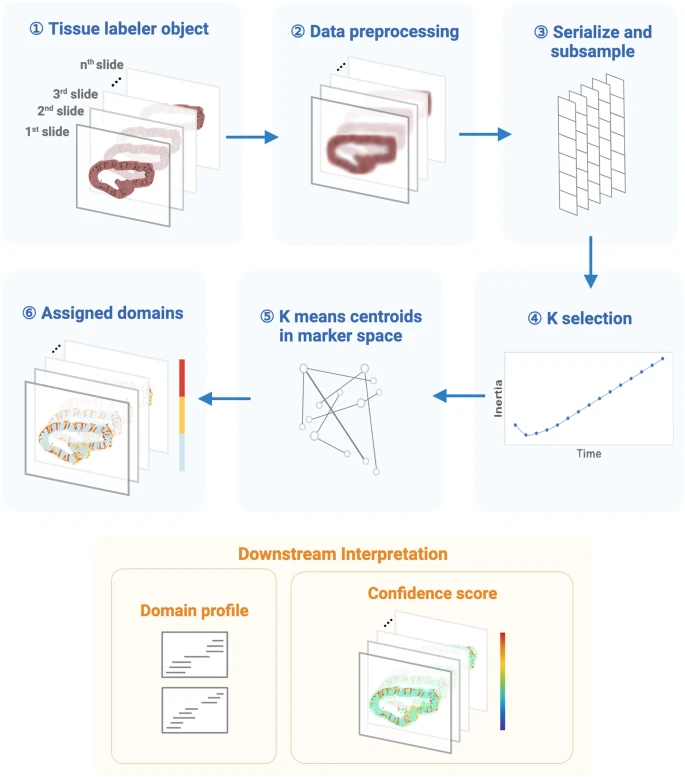
Fig. 1: The workflow of the MILWRM pipeline.
MILWRM begins with constructing a tissue labeler object from all the sample slides that undergo data preprocessing, serialization, and subsampling to create a randomly subsampled dataset used for k-means model construction. This subsampled data is used to find an optimal number of tissue domains, and k-selection using the adjusted inertia method. Finally, a k-means model is constructed, and each pixel is assigned a TD. Each TD has a distinct domain profile describing its molecular features. MILWRM also provides quality control metrics such as confidence scores (created with BioRender.com).