Georgina E. Sellyn, Andrea A. Lopez, Shramana Ghosh, Michael C. Topf, Heidi Chen, Eric Tkaczyk, & Jennifer G. Powers. (2024). High-frequency ultrasound accuracy in preoperative cutaneous melanoma assessment: A meta-analysis. Journal of the European Academy of Dermatology and Venereology. https://doi.org/10.1111/jdv.20179
High-frequency ultrasound (HFUS) is a safe and effective method for visualizing the characteristics of skin tumors, including how deep they are, which is important for planning treatment. Researchers wanted to see how well HFUS measures the depth of melanoma (a type of skin cancer) compared to the current best method, which involves examining the tumor tissue under a microscope (histopathology).
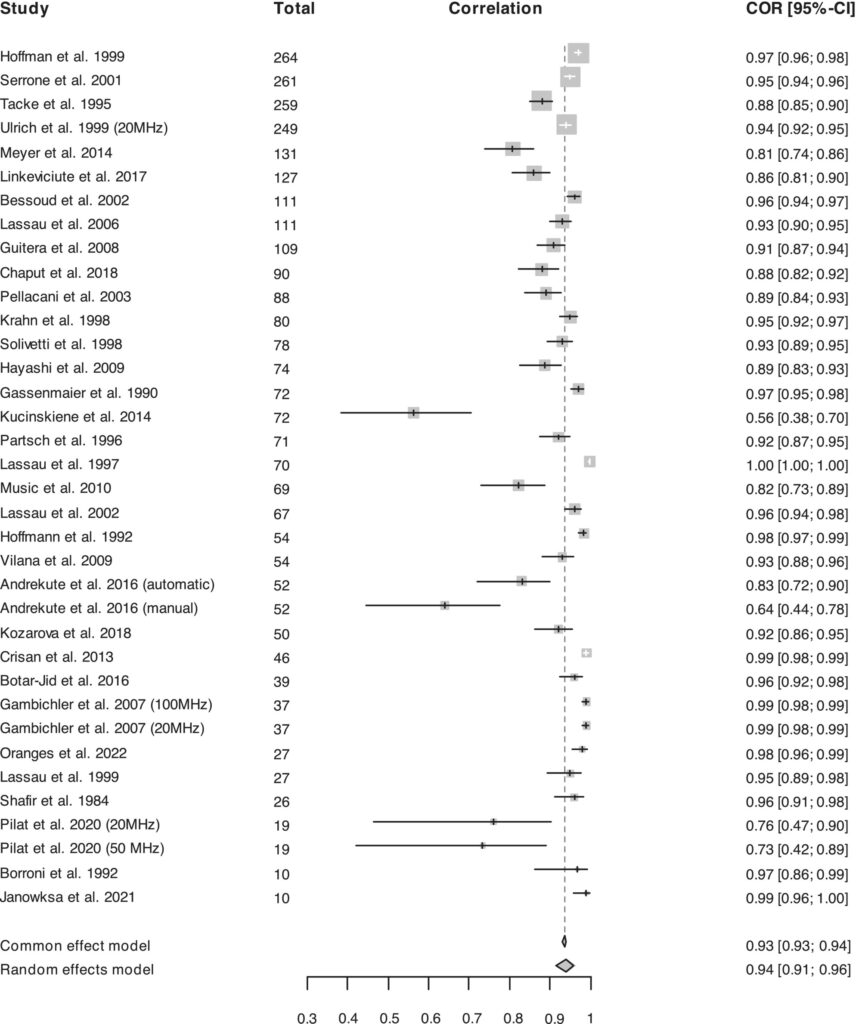
They reviewed 36 studies that used HFUS with frequencies of at least 10 MHz to measure tumor depth and then compared those measurements to histopathology results. The studies included various types of melanoma, mostly found on the trunk and limbs. The ultrasound frequencies used ranged from 13 MHz to 100 MHz, and the number of participants in the studies ranged from 5 to 264.
The correlation between HFUS and histopathology in measuring tumor depth varied, with higher frequency probes (≥70 MHz) showing the best accuracy. Specifically, lower frequency probes (10-20 MHz) were less accurate. Melanomas that were thicker (more than 0.75 mm deep) were measured more accurately by HFUS. Some reasons HFUS might show a deeper measurement than histopathology include immune cells in the tumor, presence of a mole, and tissue shrinkage during processing.
The researchers also noted that many studies did not report important details about the tumors they measured. Despite these gaps, HFUS could be a useful additional tool for assessing melanoma before surgery, especially for thicker tumors, with higher frequencies providing better accuracy.
