
Siegfried Schlunk and Brett Byram. “Expanding gCNR into a Clinically Relevant Measure of Lesion Detectability by Considering Size and Spatial Resolution.” Proceedings of SPIE Medical Imaging 2024: Ultrasonic Imaging and Tomography, vol. 12932, 1293205, 2024, San Diego, California,
Early image quality metrics were often developed with the goal of aligning with clinicians’ subjective opinions on what constitutes better images. As imaging techniques advanced, especially with the introduction of adaptive beamformers and other post-processing methods, these older metrics often failed to remain accurate. This disconnect allowed some beamformers to manipulate these metrics without actually improving clinical image quality.
In this work, a metric known as the Signal-to-Noise Ratio (SNR) for lesion detectability, originally proposed by Smith et al., is examined and improved. The new version, called generalized SNR (gSNR), incorporates the generalized Contrast-to-Noise Ratio (gCNR) to provide more reliable assessments that resist manipulation. Unlike gCNR, the original SNR includes lesion size and spatial resolution in its calculations, which enhances its robustness.
The paper analytically demonstrates that for Rayleigh-distributed data, gCNR can be expressed in terms of another metric, Cψ, proposed by Smith et al. This allows gCNR to substitute for SNR while also considering more accurate methods for estimating resolution cell size. Consequently, the gSNR provides a more reliable measure of lesion detectability that better aligns with clinical evaluations of image quality.
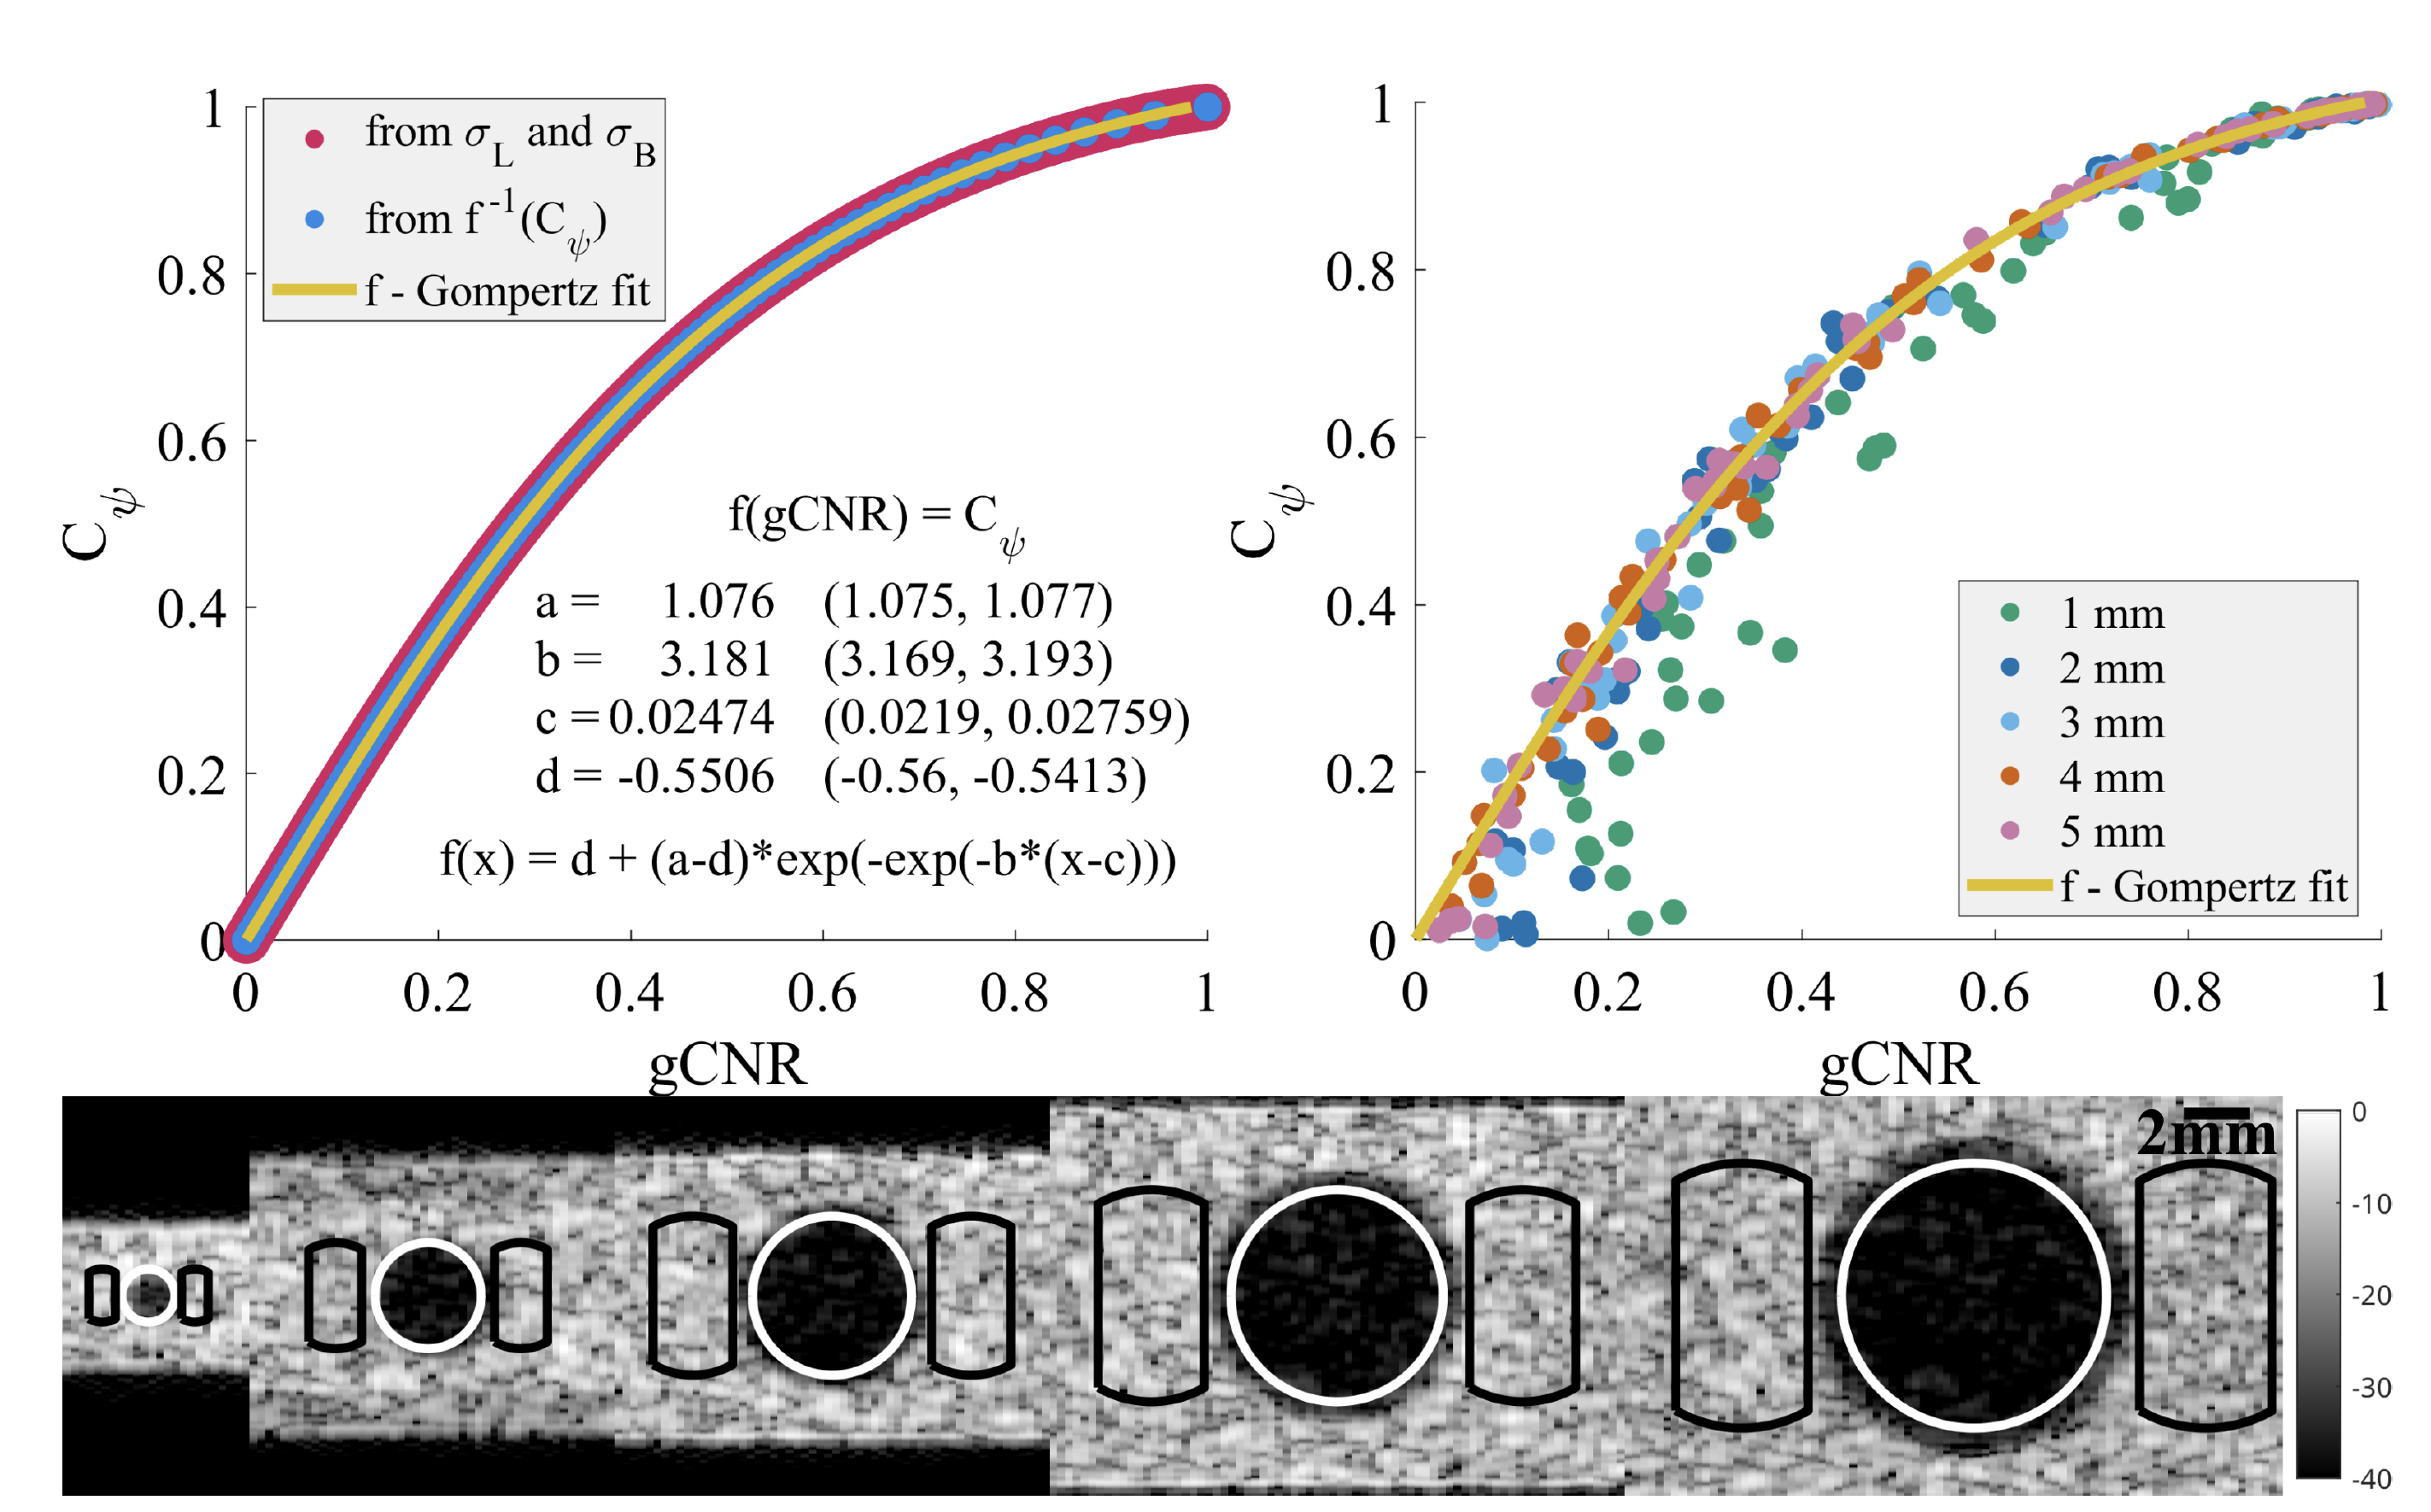
Rayleigh distributions using Equations 4 and 12 (values were generated on the interval (0, 10]). “from f−1(Cψ)” indicates
values generated from arbitrary values of Cψ and plugged into Equation 13 (values generated on the interval [0, 1]). “f –
Gompertz fit” indicates a best-fit approximation of Cψ in terms of gCNR, with the constants and equation included on
the figure for convenience. This approximation results in a maximum absolute error of 0.004254 from the true value, well
within the likely general error. The values in parentheses next to the approximated constants are the 95% confidence
interval of those estimates. (Right) The approximation of f plotted against the DAS data of the simulated lesions, showing
that the approximation holds true for ultrasound data. As expected from prior work, the smaller the lesion the less likely
is is to behave predictably, and these points show the greatest amount of deviation from the expected line. (Bottom) An
example of a -24dB amplitude simulated lesion with radii from 1 to 5 mm. The regions used for the lesions are circled in
white, while the background regions are shown in black.