Shunxing Bao, Sichen Zhu, Vasantha L. Kolachala, Lucas W. Remedios, Yeonjoo Hwang, Yutong Sun, Ruining Deng, Can Cui, Rendong Zhang, Yike Li, Jia Li, Joseph T. Roland, Qi Liu, Ken S. Lau, Subra Kugathasan, Peng Qiu, Keith T. Wilson, Lori A. Coburn, Bennett A. Landman, and Yuankai Huo. “Cell Spatial Analysis in Crohn’s Disease: Unveiling Local Cell Arrangement Pattern with Graph-based Signatures.” Proceedings of SPIE Medical Imaging 2024: Digital and Computational Pathology, vol. 12933, 1293314, 2024, San Diego, California
Crohn’s disease (CD) is a chronic, relapsing inflammatory condition that affects various segments of the gastrointestinal tract. The activity of CD is determined through histological findings, particularly by examining the density of neutrophils in Hematoxylin and Eosin (H&E) stained images. However, a deeper understanding of morphometry and local cell arrangements beyond simple cell counting and tissue morphology is needed.
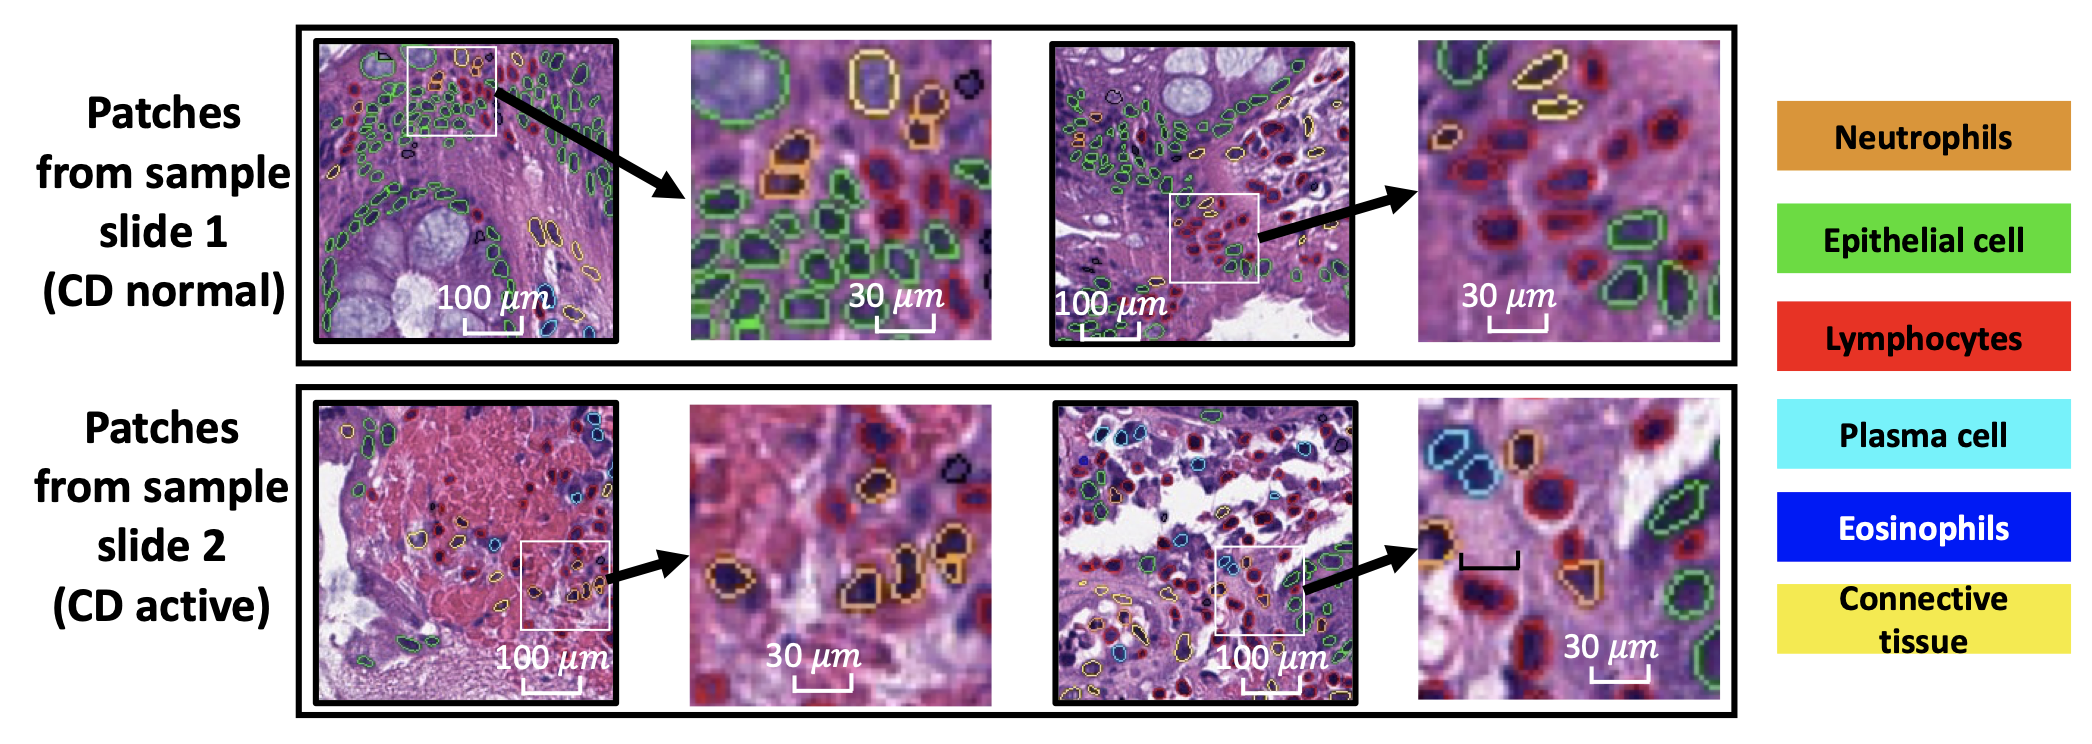
To address this, researchers characterized six distinct cell types from H&E images and developed a novel method to analyze the local spatial signature of each cell. This method involves creating a 10-cell neighborhood matrix, which represents the arrangement of neighboring cells around each individual cell. By utilizing t-SNE for non-linear spatial projection, the study presented these arrangements in scatter-plot and Kernel Density Estimation contour-plot formats. The analysis examined patterns of differences in the cellular environment, focusing on the odds ratio of spatial patterns between active CD and control groups, using data collected from two research institutes.
The findings revealed heterogeneous nearest-neighbor patterns, indicating distinct tendencies of cell clustering, especially in the rectum region. These variations underscore the influence of data heterogeneity on cell spatial arrangements in CD patients. Additionally, the observed spatial distribution disparities between the two research sites highlight the importance of collaborative efforts among healthcare organizations to ensure comprehensive analysis.
All tools used in the research analysis pipeline are available at https://github.com/MASILab/cellNN.