Yao T, Rheault F, Cai LY, Nath V, Asad Z, Newlin N, Cui C, Deng R, Ramadass K, Shafer A, Resnick S, Schilling K, Landman BA, Huo Y. Robust fiber orientation distribution function estimation using deep constrained spherical deconvolution for diffusion-weighted magnetic resonance imaging. J Med Imaging (Bellingham). 2024 Jan;11(1):014005. doi: 10.1117/1.JMI.11.1.014005. Epub 2024 Jan 5. PMID: 38188934; PMCID: PMC10768686.
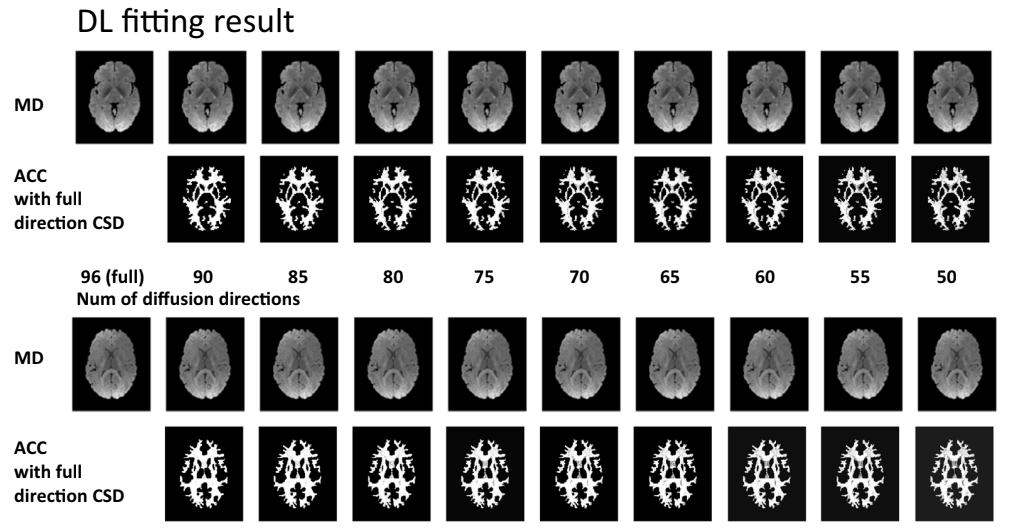
The study introduces a novel deep learning approach called deep Constrained Spherical Deconvolution (deep CSD) to improve the modeling of brain microstructure from diffusion-weighted MRI (DW-MRI). This method is designed to handle the variabilities often encountered in multisite and longitudinal studies, such as differences in hardware and scanning protocols. The deep CSD technique incorporates a three-dimensional volumetric scanner-invariant regularization scheme that significantly enhances the reproducibility and robustness of fiber orientation distribution function (fODF) estimations from repeated scans. The effectiveness of this approach was validated using datasets from the Human Connectome Project, the MASiVar dataset, and the Baltimore Longitudinal Study of Aging. Experimental results show that the deep CSD method surpasses existing benchmarks in consistency and angular correlation, offering improved performance in downstream connectivity analysis and better differentiation of subjects based on specific biomarkers. This method presents a significant advancement in the field, providing a potentially adaptable solution to data harmonization challenges in neuroimaging.
