Advanced Dynamics of Mechanical Systems

Zhi Zheng, Electrical Engineering, working with
Nilanjan Sarkar, Professor of Mechanical Engineering
Overview
The purpose of this research study was to examine the efficacy of computer animation and educational video on helping students learn rigid body rotation. This research was be conducted with students enrolled in the course Advanced Dynamics of Mechanical Systems during Spring 2016. One of the learning objectives of this class is to understand the mathematical definition and representation of rigid body rotations, which is a fundamental concept that many students who major in engineering need to learn. Additionally, this class aids in preparing students for study advanced courses in engineering such as Introduction to Robotics. To help the students build intuition on rotation and link this physical motion with mathematical representations, we designed visualization tools that display rigid body (for example, a rectangle block) rotation based on the mathematical parameter inputs (for example, a rotation matrix or Euler angles). The instructor used the animation tool for in-class demonstration, and distributed this tool to the students to facilitate their learning after classes. To help the students reinforce their learning on the course content, we also developed short review videos that cover the major concepts and key points of the classes. Students were able to access these videos online at any time after class. Those videos were also be embedded with the instructions and demonstrations on how to use the visualization tool. This was designed to help the students increase the flexibility of their learning experience.
Our primary hypothesis was that the visualization tools and the review videos would benefit the students’ learning. Evidence supporting this hypothesis would make the tools we have developed valuable to instructors at other institutions. The students’ response to surveys, in-class response, homework performance and test scores will be collected for qualitative and quantitative analyses.
Procedure
At the beginning of this study, students took a pre-study survey regarding their experience on visualization tool, online review video, and their expectation on whether/how these elements were involved in the course. During the classes, the instructor used the visualization tool for demonstration. An instructional staff observes the in-class dynamics, mainly including:
- The conversation between the students and the professor. For example, the questions that the students ask to the professor and the professor’s answers.
- The students’ response to the animation tool. For example, whether they pay attention to the animation demonstration.
- The interaction between the students. For example, their conversation on the class content.
- The students’ engagement and attitude. For example, whether they enjoy observing the animation, and whether they pay attention on the professor’s instructions.
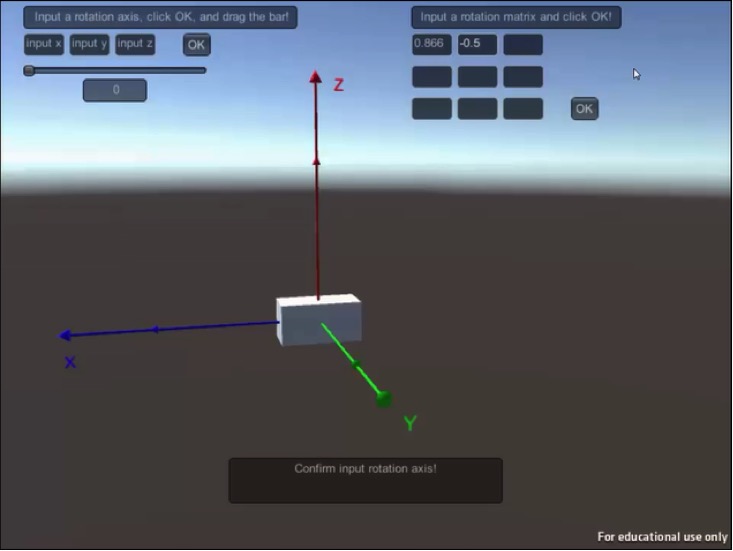
This study had two sections based on the classes’ content. The first section was on Rotation Matrix and Axis/Angle representation of Rotation. A visualization tool was developed with Unity game engine as shown in Fig. 1. The students input a rotation matrix and see the corresponding rotation of the box in the middle of the scene. They could also input an arbitrary rotation axis, and drag a bar to see the box rotating around the axis from 0 to 360 degrees.
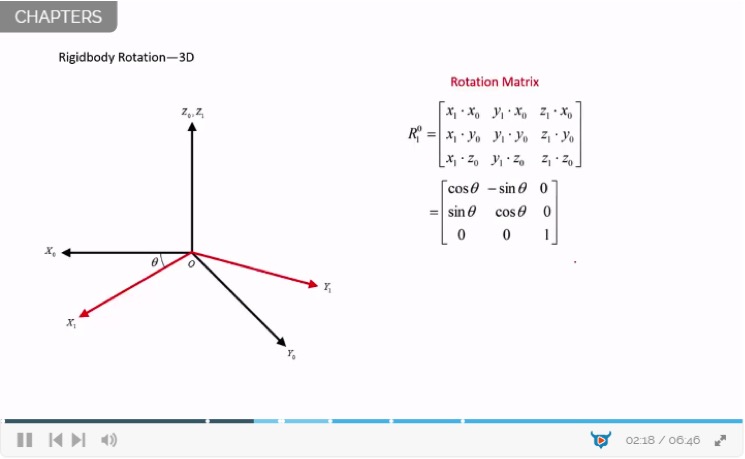
A video was recorded to help student review the key knowledge of this topic online. Detailed instructions on how to use the visualization tool were given at the end of the video with examples. This video was embedded with multi-choice questions as self-assessment for the students. Fig. 2 shows the screen shot and link to the video.
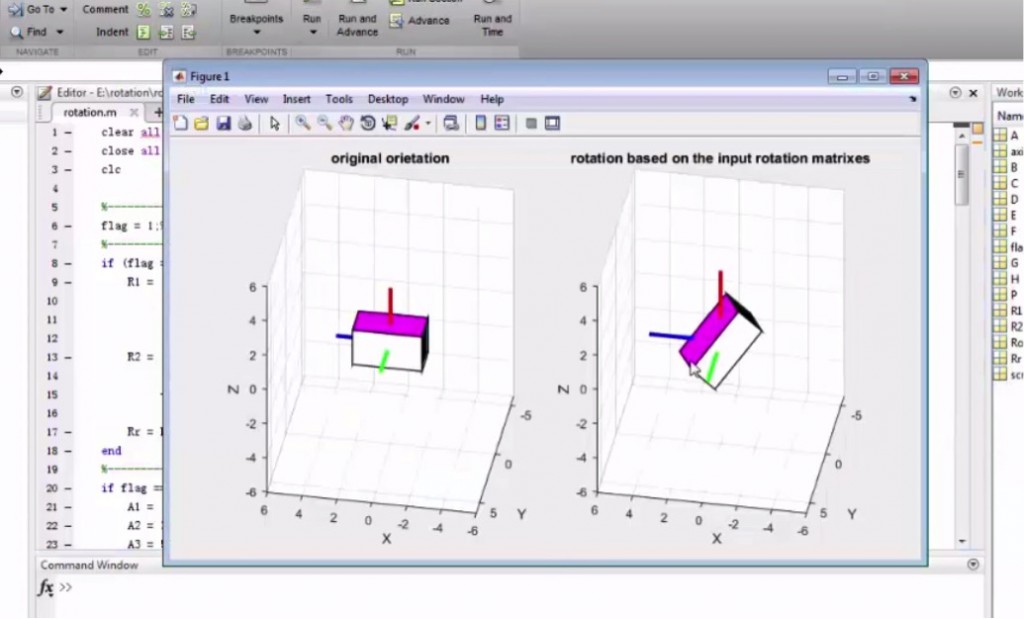
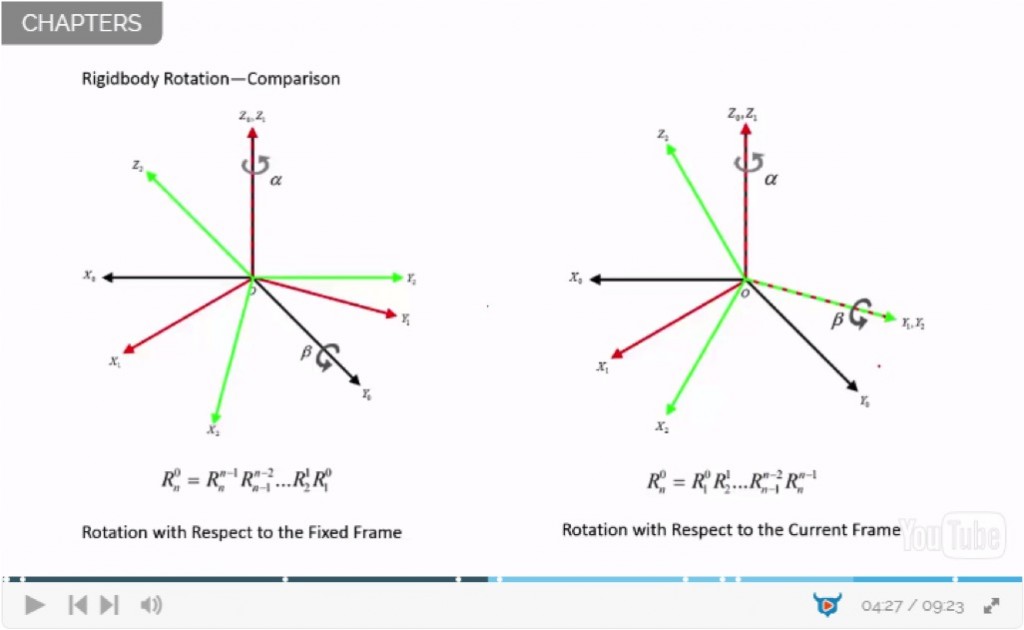
The second section of this study was about Composition of Rotations and Euler Angles. A MATLAB program was written as another visualization tool (Fig. 3). The students can change the source code to plot different composition of rotations on a box. They could also plot the rotation corresponds with a set of ZYZ Euler angles on this box. The second review video on this topic is shown in Fig. 4.
After each section, an in-study survey was filled out by the students regarding:
1) The design quality of the visualization tool and review video;
2) Whether the tool and video are helpful in learning.
User study design
The designed visualization tools and the review videos were evaluated in a pilot user study conducted in the course Advanced Dynamics of Mechanical Systems during Spring 2016. This study was approved by the Vanderbilt University Institutional Review Board. As illustrated in Fig. 5, each participant was asked to fill out a pre-survey at the beginning of this study, regarding their previous experiences on visualization tools and rigidbody rotation. Then, they could watch the review videos and try the visualizations tools while doing their homework. Note that the visualization tools and the review videos could help the students learn related knowledge, but did not give the answers of their homework directly. After finished their homework, they were asked whether they used the visualization tools and the review videos. The participants were also asked to evaluate the quality of the visualization tools and the review videos. Ten students in the class agreed to participate. Nine of them filled out the pre-survey and eight of them answered the post-survey. The result analysis for this study was based on the surveys.
Fig. 5 User study flow
Results
Pre-survey
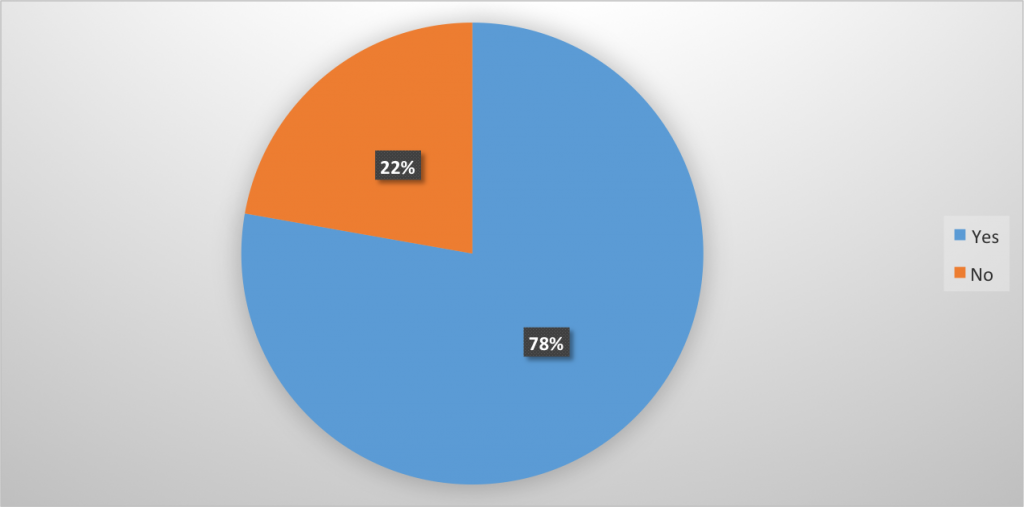
In the pre-study survey, we asked whether the participants have used any visualization tools in other STEM classes before. As shown in Fig. 6, 44% of them answered yes. Their previous experiences included MATLAB, Inventor, and Solidworks. Then, we asked their previous experiences on rigidbody rotation. Surprisingly, as shown in Fig. 7, 78% of the participants had learnt rigidbody rotation to some extent before taking the course.
Fig. 6 Percentage of the participants who had previous experiences on visualization tools
Fig.7 Percentage of the participants who had previous experiences on rigidbody rotation
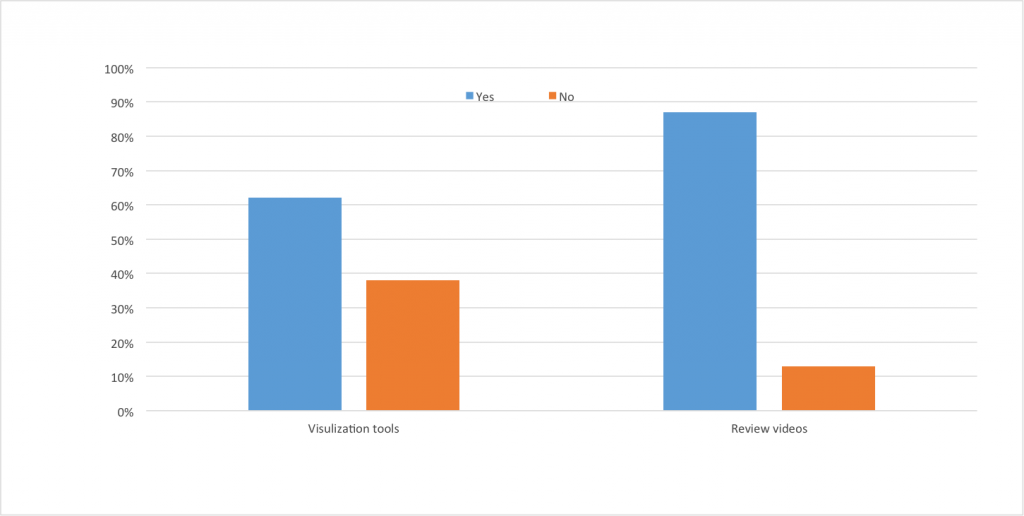
Fig. 8 Percentages of the participants who did/did not use the tools and videos in completing their homework
As shown in Fig. 8, 62% of the participants reported they used the visualization tool in solving their homework. We further asked the participants to rate the quality of the visualization tools from 0 (not helpful at all) to 10 (very helpful). The participants gave an average score of 6.1 (Min = 0, Max = 9). This showed that the visualization tools had a moderate value in helping the participants to learn. A representative comment given by one participant regarding his/her experience on using the tools was “The tool helped visualize the rotation I was trying to get to…” This was exactly our design goal. Meanwhile, form the participants who did not use the tools, a typical comment was “Um… I played it for sure and it’s fun! It’s just the homework is not that hard for me to use the animation tool to help me understand it better.” This comment indicated that the homework was not difficult to solve for students who had solid previous experience on rigidbody rotation. Since the tools were designed for students who had no experience on rigidbody rotation to understand the fundamental concept, it is understandable that most of the participants in this study may not need much help from the tools. Therefore, a moderate score was given by the participants.
In contrast with the visualization tools, 87% (7 out of 8 participants who filled out the post-survey) of the participants used the review videos in doing their homework, and found the videos were more helpful than the visualization tools. The average score of the review videos was 7.5 (Min = 5, Max = 10). A representative comment of the participants who used the review video was “The video was informative and acted as a good reference for the material.” This comment was quite aligned with our design goal. The student who did not use the review video gave the reason – “There is no wifi at home when I worked the homework.”
Conclusion and Discussion
In summary, we found that most of the participants found the review videos useful, while fewer students found the visualization tool helpful for solving homework problems. As shown in the pre-study survey, most of the participants had experience with the content. However, the tools and the review videos were initially designed for students new the content. Therefore, the previous experience might have reduced the need for the tools. However, since the review videos covered more deep mathematical key knowledge of the class content, which might not be remembered clearly by the students or still new to some of them, the review videos were considered more helpful.
Future work
We believe that the tools and the videos will be more useful for students who are new to the content. These tools and videos are planed to be provided to the students in courses like Introduction to Robotics in the future. Hopefully the students will find them useful in their study.
There are also more future works suggested by the participants. The current visualization tools can only be used in Windows operation system. Some of the participants mentioned that a version for Mac will be needed. Students responded that they like the tools and the videos, and hoped these will be expended to cover more content of the course.
As insisted in the current design, the future visualization tools and the review videos should be designed in a way that students can use them for understanding the knowledge, but still need to make their own intellectual effort on completing homework and projects.


