Siwei Zhang is first author of JAMIA paper
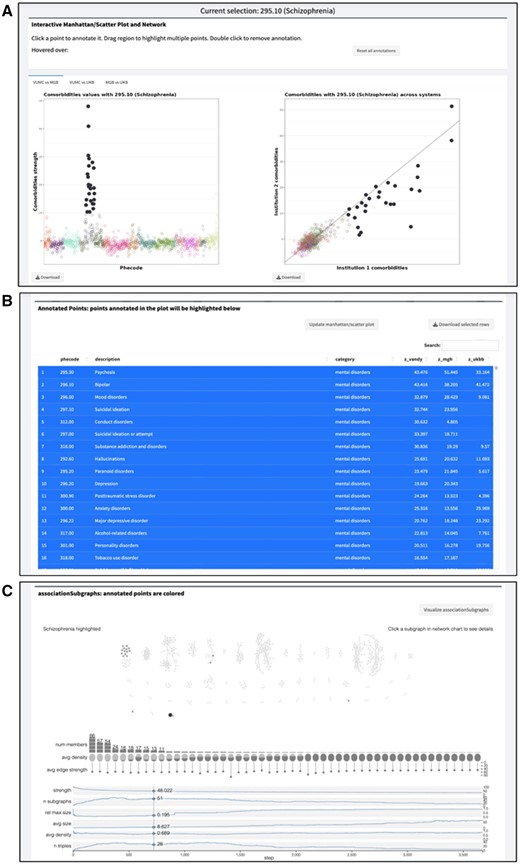
Congratulations to PhD candidate Siwei Zhang, alumnus Nicholas Strayer (PhD 2020; now at Posit), senior biostatistician Yajing Li, and assistant professor Yaomin Xu on the publication of “PheMIME: an interactive web app and knowledge base for phenome-wide, multi-institutional multimorbidity analysis” in the Journal of the American Medical Informatics Association on August 10. As stated in the abstract, “PheMIME provides an extensive multimorbidity knowledge base that consolidates data from three EHR systems, and it is a novel interactive tool designed to analyze and visualize multimorbidities across multiple EHR datasets. It stands out as the first of its kind to offer extensive multimorbidity knowledge integration with substantial support for efficient online analysis and interactive visualization.” Collaborators on the paper include members of Vanderbilt’s Division of Genetic Medicine, Department of Biomedical Informatics, Department of Urology, Department of Obstetrics and Gynecology, Division of Hematology and Oncology, VICTR, Department of Pharmacology, Center for Drug Safety and Immunology, and Department of Psychiatry and Behavioral Sciences, as well as colleagues at Massachusetts General Hospital, North Carolina State University, Murdoch University (Australia), and the Broad Institute. Dr. Xu is corresponding author.