Nonlinear Statistical Tools
A number of statistical techniques have been introduced to try to evaluate time series data. Their purposes include 1) attempting to distinguish chaotic time series from random data ("noise"), 2) assessing the feasibility that the data are the product of a deterministic system, and 3) assessing the dimensionality of the data. Here we introduce some concepts basic to these efforts.
Return Maps
What is a return map?
A plot of xt against xdelta t
Why is it plotted?
To evaluate the structure of the measured trajectory.
To illustrate, we start with a time series that was generated by randomly sampling from (0,1) interval. If we plot xn against xn+1 we get ...
 Return Map of time series from random Uniform distribution.
As expected, the points scatter.
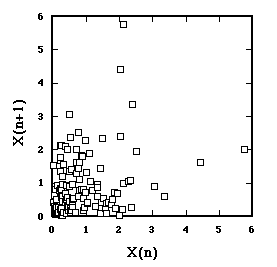
Here's a return map from another random time series.
This one sampled from an exponential (positively skewed) distribution.
 Return Map of time series from exponential distribution.
Here we do not scatter all over. What's the point? You may have heard that a symptom of chaos is when the return map is confined to a region of the map. This illustrates how such a collection can occur, but from a random system.
Now, remember this time series?
 A nonrandom Time Series
It's from the Logistic Map in the chaotic region, r=3.99.
What does its Return Map look like?
 Return Map from Logistic Map, r=3.99
The structure of the generating function is entirely captured.
So, a return map can be very handy, provided the data are from a one-dimensional system. If the system has more than two-dimensions, the return map has limited utility.
Embedding dimension
Okay. One more meaning of the term 'dimension'.
It comes from extending the concept of a return map.
Successive n- tuples of data are treated as points in n-space.
The Return Map is an embedding dimension of 2.
Suppose, for example, that the first six data values were
4, 2, 6, 1, 5, 3,
then for an embedding dimension of 3.
P(1)= (4,2,6)
P(2)= (2,6,1)
P(3)= (6,1,5), and so forth.
What's the point?
Contemporary statistical analyses examine the geometric structure of obtained time series embedded with differing dimensions.
Types of 'Noise'
An older, linear, tool, for examining time series, is Fourier analysis, specifically, FFT (Fast Fourier Transform). FFT transforms the time domain into a frequency domain, and examines the series for periodicity. The analysis produces a power spectrum, the degree to which each frequency contributes to the series. If the series is periodic, then the resulting power spectrum reveals peak power at the driving frequency.
Plotting log power versus log frequency,
- White noise (and many chaotic systems) have zero slope.
- Brown noise has slope equal to -2.
- 1/f (Pink) noise has a slope of -1.
1/f noise is interesting because it is ubiquitous in nature, and it is a sort of temporal fractal. In the way a fractal has self-similarity in space, 1/f noise has self-similarity in time.
Pink noise is also a major player in the area of complexity, our next topic.
Next Section: Complexity