Bifurcation Diagram
So, again, what is a bifurcation? A bifucation is a period-doubling, a change from an N-point attractor to a 2N-point attractor, which occurs when the control parameter is changed.
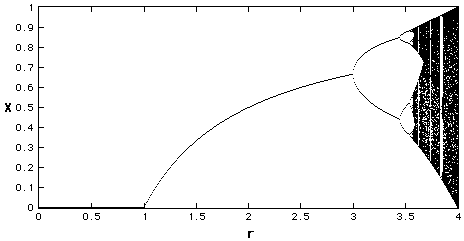
A Bifurcation Diagram is a visual summary of the succession of period-doubling produced as r increases. The next figure shows the bifurcation diagram of the logistic map, r along the x-axis. For each value of r the system is first allowed to settle down and then the successive values of x are plotted for a few hundred iterations.
 Bifurcation Diagram r between 0 and 4
We see that for r less than one, all the points are plotted at zero. Zero is the one point attractor for r less than one. For r between 1 and 3, we still have one-point attractors, but the 'attracted' value of x increases as r increases, at least to r=3. Bifurcations occur at r=3, r=3.45, 3.54, 3.564, 3.569 (approximately), etc., until just beyond 3.57, where the system is chaotic.
However, the system is not chaotic for all values of r greater than 3.57.
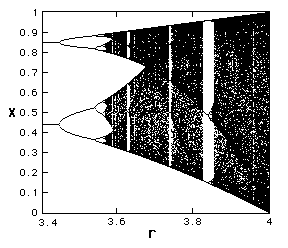
Let's zoom in a bit.
 Bifurcation Diagram r between 3.4 and 4
Notice that at several values of r, greater than 3.57, a small number of x=values are visited. These regions produce the 'white space' in the diagram. Look closely at r=3.83 and you will see a three-point attractor.
In fact, between 3.57 and 4 there is a rich interleaving of chaos and order. A small change in r can make a stable system chaotic, and vice versa.
Next Section: Sensitivity to Initial Conditions